This IM describes procedures used to perform smoothness testing on new pavements and bridge deck surfaces. A certified person is required to perform the testing and the reduction and reporting.
PROCEDURE
A. Apparatus
1. Automated procedure
a. An inertial profiler meeting requirement of AASHTO M 328. See Figure 4
b. Reporting Form #821301 or a modified form with the same format.
2. Manual procedure
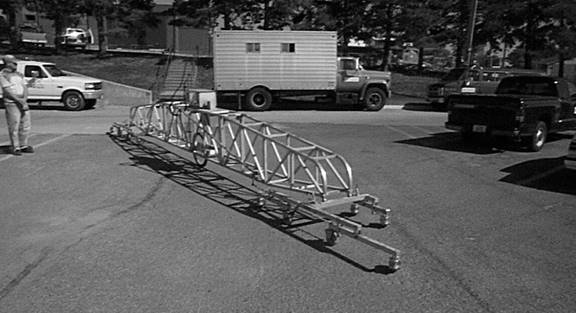
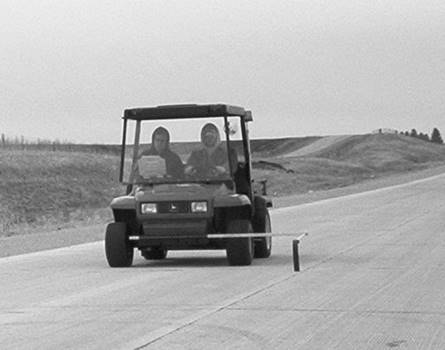
a. California or Ames Engineering type, 25-foot profilograph. See Figure 1, 2, and 3
b. Plain recording chart paper for the manual units.
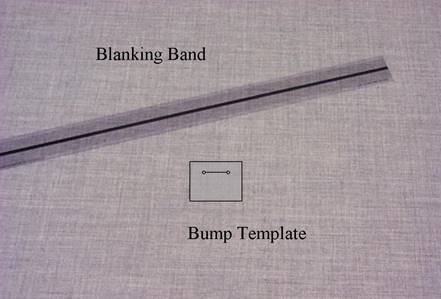
c. Blanking band, a plastic scale 1.70 in. wide and 21.12 in. long. The center of the scale has an opaque band 0.2 in. wide extending the entire length and scribed lines 0.1 in. apart, parallel to the opaque band. This blanking band is used for reducing bridge deck traces and non-primary road traces. See Figure 5.
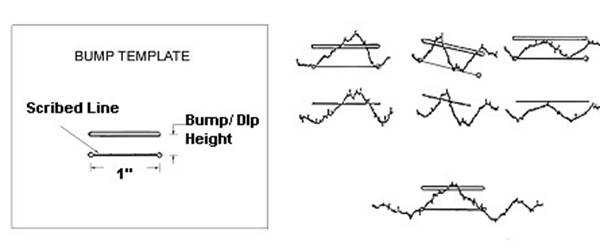
d. Bump template, a plastic template with a line 1 inch long scribed on one face with a small hole or scribed mark at both ends, and a parallel slot (or edge) 0.5 inches away. See Figure 5.
e. Scale graduated in tenths of an inch.
f. Medium-point ballpoint pen in red ink or other contrasting color to the profile trace.
g. Calculator.
h. Reporting Form #821301 or a modified form with the same format.
B. Profiler Approval
All profilers must first be evaluated by the Iowa DOT Materials Laboratory to be considered for use under Articles 2316, 2317, 2428 and 2529.03, H of the Standard Specifications. The manufacturer or contractor shall arrange for testing on an HMA pavement and a longitudinally tined PCC pavement with a profile index of less than 3.0 inches per mile and shall contact the Special Investigations Engineer to arrange for side-by-side testing with the Iowa DOT test equipment. The units shall be within 0.5 inches per mile on the 0.2-inch blanking band and within 10% on the 0.0-inch blanking band. Re-evaluation may be required if the unit fails to correlate with the Iowa DOT monitor testing.
C. Traffic Control
1. Follow Traffic Control Layouts in the Iowa DOT Standard Road Plan sheets TC-231 and TC-431 when performing smoothness testing on pavements or bridges under traffic. The link is http://www.iowadot.gov/erl/current/RS/Navigation/tc.htm.
2. Remember that these are minimum traffic control layouts and that additional signing or more elaborate traffic control layouts (such as a complete lane closure) may be required. Two-way radios may also be required.
3. Safety first! No test result is worth a crash, personal injury or fatality.
D. Calibration
A vertical and a horizontal calibration are required for the profilograph or profiler to work properly. Prior to use, the Iowa DOT shall calibrate profilographs and profilers. The calibration is good for a maximum of one year. The entire profilograph must be assembled for inspection of condition. Contractor-owned ProScan units must also be calibrated annually in the Central Materials Laboratory.
1. The horizontal calibration is done on a 528-ft. test section. The profilograph trace (profilogram) shall be identical to the reference trace when viewed on a light box. A rotating calibration wheel may also be used. The scale is 1:300. The unit shall be adjusted according to the manufacturer’s instructions to within a tolerance of 0.25% (0.05 inches on the profilogram, 1.3 feet on the test section).
2. The vertical calibration or verification is done with the unit stopped. Calibration blocks (machined to within 0.01 inches.) are slid under the recording wheel or sensor. For manual units, measure the vertical trace line from the base line to the peak and return. (NOTE: The trace line must return to the base line.) For computerized units follow the manufacturer’s procedure. The tolerance shall be ± 0.01 inch.
A rotating calibration wheel shall also be used with the same vertical calibration test tolerance as above. The Profile Index computed by the profilograph shall be within 10% of the established 0.0-inch blanking band index for the calibration wheel. Those profilographs not meeting the tolerance and those profilographs and profilers not calibrated on the wheel may be required to demonstrate compliance on a pavement section. Compliance would be determined comparing the computed index to a calibrated profilograph or profiler run at the same time. The units shall be within 0.5 inches per mile on the 0.2-inch blanking band and within 10% on the 0.0-inch blanking band.
E. Computer Settings
Below are the settings that shall be used for testing in Iowa.
PROFILOGRAPH/ PROFILER CALIBRATION FACTORS |
|||||
|
|
|
|
FILTER TIRESETTINGS PRESSURE |
||
|
MANUFACTURER |
MANUAL |
COMPUTER |
LOW PASS/ DATA |
170kPa (25 PSI) |
OTHER |
|
AMES |
X |
--- |
--- |
--- |
As Calibrated |
|
AMES |
--- |
X |
2.0 |
X |
--- |
|
AMES LISA (1) |
--- |
X |
2.0 |
--- |
10 PSI |
|
COX |
X |
--- |
--- |
X |
--- |
|
MCCRACKEN |
X |
--- |
--- |
X |
--- |
|
MCCRACKEN |
--- |
X |
2.0 |
X |
--- |
|
MACBETH |
X |
--- |
--- |
--- |
As Calibrated |
|
LAB-BUILT |
X |
--- |
--- |
X |
--- |
|
SSI |
--- |
X |
2.0 |
X |
--- |
|
SSI HIGH SPEED (2) |
--- |
X |
2.0 |
--- |
As Calibrated |
(1) The Gocator laser, RoLine laser, and TriODS triple laser are approved for both HMA and tined PCC. The single laser is approved for HMA only.
(2) The Gocator laser and RoLine laser are approved for both HMA and tined PCC. The single laser is approved for HMA only.
|
PROFILOGRAPH/ PROFILER REDUCTION SETTINGS |
||
|
|
Blanking Band* |
0.20 inches or 0.001 inches |
|
|
Scallop Rounding |
0.01 inches |
|
|
Minimum Scallop Height |
0.03 inches |
|
|
Minimum Scallop Width |
0.08 inches on trace (2.0 ft. actual distance) |
|
|
Filter Type |
Butterworth |
|
|
Bump/Dip Height |
0.50 inches |
|
|
Bump/Dip Width |
25 feet actual distance |
* A zero inch blanking band is used for primary pavement segments.
The current versions of the McCracken profilograph software and the Ames LISA software have a filter called a blanking band filter factor or high pass filter. The filter should be set to “0” (off) for the majority of profilograph testing. The filter setting is displayed with the other information at the end of the profilogram. It is intended to be used only on short radius horizontal curves to compensate for the effect of the superelevation. The result of using the filter is a reduction in the longer wavelength features of the profilogram and a possible reduction in the profile index.
F. Test Procedure
1. The contractor (or sub-contractor) responsible for smoothness testing shall give the Project Engineer and the District Materials Engineer 48 hours’ notice prior to testing so the District Materials Office may provide a certified technician for verification testing.
2. Dirt and debris may affect profilograph index readings. Excessive mud or caked mud must be removed prior to testing. A grader blade or power broom will knock concrete crumbs off longitudinal or transverse grooving. This will produce fewer spikes and a better profile trace to accurately reduce.
3. Since the profilograph is symmetrical, testing may be performed in either direction of traffic. It is desirable to test in the direction of traffic and reduce traces in the direction of traffic wherever possible. While this is easy to do with manual profilograph machines and reduction methods, it is recognized that some computer profilographs may have problems meeting these criteria. It is not the intention to penalize for the use of computer profilographs.
4. Pointer bar use is mandatory except on bridge decks.
5. More than one person may be required to hold the back end of the profilograph exactly at 1/4 point or wheel track on superelevated or sharp horizontal curves.
6. The profilograph is pushed at walking speed. Do not push or pull with a truck or car.
7. For manual units, lift the test wheel and rotate it to take slackness out of the chain, and lower it to the pavement surface at the starting point prior to testing. Lifting the test wheel at the beginning and end of each trace clearly define termini. This may also be accomplished by pulling the recording cable.
8. Note stationing on the profilogram at least every 1000 ft. and preferably every 500 ft. Closer station references are highly desirable where possible. This station referencing on the trace is used to accurately locate 1/2 in. bumps (or dips). Use landmarks, roadway signs, maintenance markers, or mileposts on Hot Mix Asphalt (HMA) resurfacing projects. Spray paint can be used on the pavement for computer profilographs to mark the location of 1/2 in. bumps (or dips).
9. Completely label both ends of the profilograph roll and note the stationing and roll number at each end of the roll. Add the test report laboratory number to each end after reduction.
10. When a segment is corrected by grinding to improve the profile index, the entire segment must be retested and a new profile index calculated to determined specification compliance. The profilograph roll from the corrected area shall be labeled at both ends with the information from the original profilograph roll and a note indicating that the area was corrected by grinding.
11. Test unit positioning
a. Testing is normally done in wheel path unless noted differently elsewhere in the specifications or this I.M. The specifications identify two locations for testing, the ¼ point and the wheel paths.
1) For ¼ point testing, the center wheel shall be 6 feet from the centerline or lane line.
2) For wheel path testing, the center wheel shall be 3 feet and 9 feet from the centerline or lane line. See Figure 6.
b. Where possible, the profilograph should start with the front wheel at beginning of the new construction for which the contractor is responsible. See Figure 7.
c. Test to header whenever possible stopping the front wheel at the header, and starting at that same location for the next section. The header must be included in the count and checked for 1/2 in. bumps or dips and count.
d. The 16 ft. to 150 ft. odd length at the end of a day's run due to barrier fences, machinery, paving not placed yet, etc., should be included in the next day's run. When a profiler is used, this distance may be extended to provide for a safe starting and stopping distance.
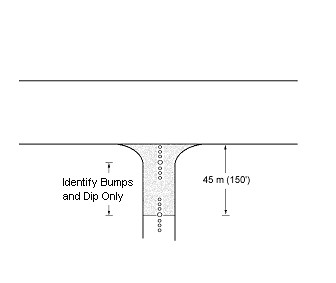
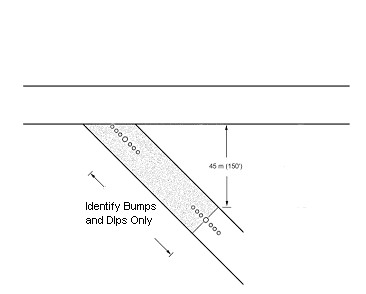
e. The first 150 ft. on side roads which are 600 feet or longer will be omitted from the profile index. This 150 ft. distance will be measured perpendicular to mainline paving and from edge of pavement to edge of pavement. This area will be checked for bumps and dips only. See Figure 8.
f. Acceleration and deceleration tapers to ramps and loops are tested in the ¼ point. The end of the entrance and exit ramp tapers is located at the point where the ramp is full lane width.
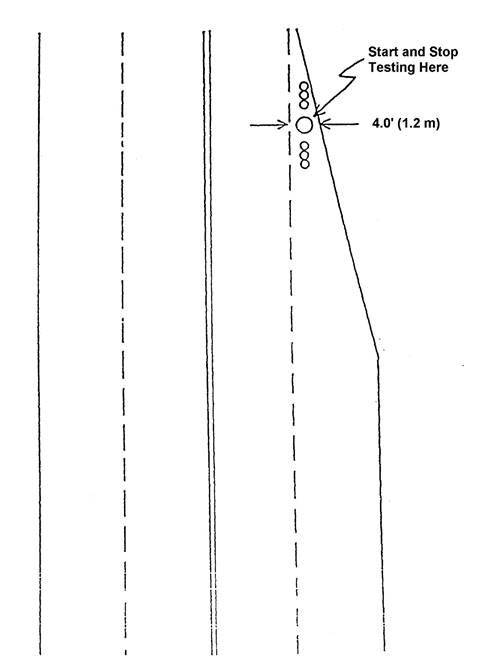
g. Testing starts on transitions and tapers to lanes and ramps when the pavement reaches a width of 4 feet. See Figure 9.
h. Test the wider pavement width on ramps to represent ramp smoothness if the ramp width is placed in more than one pass (such as on HMA resurfacing projects). Testing should be performed as closely to the center of the ramp driving lane as possible. If the pavement joint falls exactly at the center of the driving lane of the ramp, then offset 2 ft. to the right with traffic to test with the profilograph.
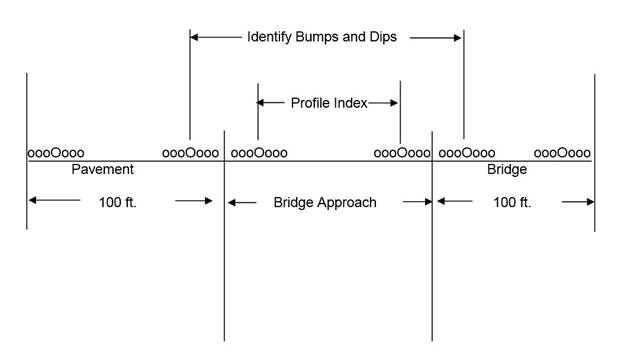
i. When testing bridge approaches, push the profilograph 100 ft. on the pavement and 100 ft. on the bridge to get enough trace to correctly position the blanking band through the bridge approach area. Only the actual bridge approach length is analyzed as shown in Figure 10. The header at the bridge and at the approach and adjacent pavement are checked for bumps and dips.
j. When testing over 4 in. expansion joints, fill the space with wood, cover the space with metal (or some other material) so that the small profilograph wheels can roll over the joint.
G. Manual Trace Reduction & Bump Locating Procedure
1. A red (or other contrasting color) outlining procedure is mandatory on all manually reduced profilograms from PCC pavement sections involving price adjustments or incentive payments. No outlining shall be done on HMA or bridge decks. On bridge decks, the deck should be swept and the profilograph should be pushed slowly enough so that no or little spiking occurs.
a. Outlining is not intended to correct or compensate for an incorrectly run profilogram. Continuous spiking and chatter indicates that the profilograph was operated too fast or the pavement was not cleaned prior to testing. Profilograms with continuous spiking or chatter are not acceptable and should be rerun.
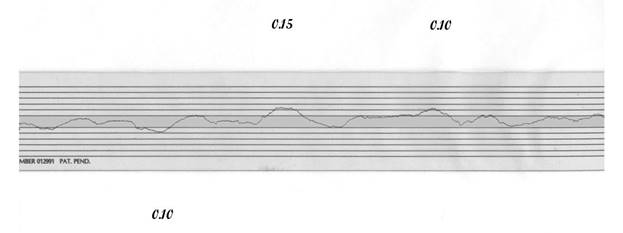
b. The outlining procedure removes spikes and minor deviations caused by rocks, texturing, or dirt. See Figure 11. To outline a trace, care should be taken to average only normal spiking. Scallops must not be smoothed or averaged during the outlining.
c. Start at one end of the trace. Carefully draw a line along the trace profile. Draw along scallops, even those less than 0.08 inches wide.
2. Use a 1/2 in. bump template to locate bumps or dips for removal. At each prominent bump or dip on the profile trace, place the template so that the small holes or scribe marks at each end of the scribed line intersect the profile trace to form a chord across the base of the dip or indicated bump. The line on the template need not be horizontal. With a sharp pencil draw a line using the narrow slot in the template (or edge) as a guide. Any portion of the trace extending above or below this line will indicate the approximate length and height of the bump or dip in excess of the specification.
3. There may be instances where the distance between easily recognizable low points is less than 1 in. (25 ft.). In such cases a shorter chord length shall be used in making the scribed line on the template tangent to the trace at the low points. It is the intent, however, of this requirement that the baseline for measuring the height of bumps or dips will be as nearly 25 feet (1 inch) as possible, but in no case to exceed this value. When the distance between prominent low points is greater than 25 feet (1 inch) make the ends of the scribed line intersect the profile trace when the template is in a nearly horizontal position. A few examples of the procedure are shown in Figure 12.
4. Place the blanking band over the profile to remove or "blank out" as much of the profile as possible. When this is done, scallops above and below the blanking band usually will be approximately balanced. The blanking band must not move when counting scallops in a segment. See Figure 13.
The profile trace may move from a generally horizontal position when going over the transition to small radius superelevated curves. When such conditions occur, contact the District Materials Engineer. The District Materials Engineer may allow the profile at that segment to be broken into short sections and the blanking band repositioned on each section while counting scallops.
5. Measure and total the height of all the scallops appearing both above and below the blanking band, measuring each scallop to the nearest 0.05 in.. Round down as well as up. Do not count a scallop as 0.05 in. just because you see the profile line or there is space under the line.
Short sections of the profile line may be visible outside the blanking band, but unless they project 0.03 in. or more and extend longitudinally for 2.0 feet (0.08 in. on the profilogram) or more, they are not included in the count. See Figure 11 for illustration of these special conditions. Spikes are not counted. Double-peaked scallops are only counted once as the highest peak.
Write the total count in inches on the profilogram above the profile line (toward the center of the segment) and circle it. Outline the position of the blanking band when reducing the trace for later repositioning to check trace reduction procedure. Do not rotate the blanking band about the last end position when moving forward with trace reduction. Blank out as much of the profile as possible for each segment.
When a scallop occurs at the end of the blanking band, count the scallop only once. Place the scallop in the 0.1-mile segment where the peak is highest.
Always use the measured trace length in computations. This length will not agree exactly with distance by subtracting stationing. Always use ± after the ending station on the report.
6. The last segment counted is generally not an even 0.1-mile. If not, its length should be scaled to determine its length in miles. For the example shown below, the odd length segment measures 7.60 in. in length.
|
|
If the odd length segment is 0.047 miles (250 feet) or less, it is added to and included in the evaluation of the adjacent segment in that section. If the odd length segment is more than 0.047 miles it is evaluated on its own.
The profile index is determined as inches per mile in excess of the blanking band. For 0.1-mile segments, the profile index can be determined from the inches of roughness by moving the decimal place one position to the right. For odd length segments and metric, the profile index is determined by dividing the inches by the segment length in miles. The weighted average for a day's run is determined by dividing the total inches of roughness for the day's run by the total length in miles of the day's run.
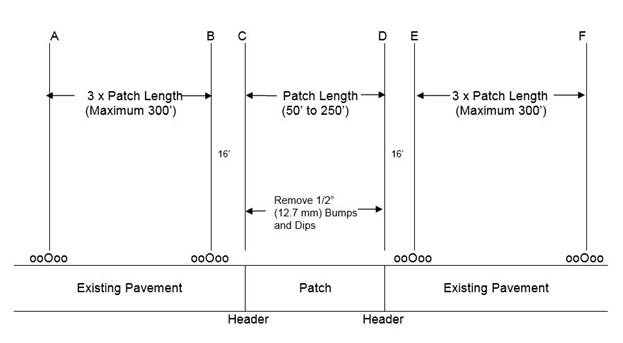
H. Testing of Patches
1. Testing of pavement patches is covered in Article 2529.03,H of the Standard Specifications. Patches between 50 feet and 250 feet are evaluated using the Average Base Index (ABI).
2. Figure 14 shows the areas to be tested and analyzed.
I. Reporting
1. The test report is required for project acceptance. Contractors should put their company name at the top of Iowa DOT Form #821301 and produce a new form. Remove "District Materials Engineer" at bottom of form. Contractors may develop their own form but it shall follow the same layout and style as Form #821301.
2. There are several types of reports:
a. Information Only. Used by the DOT inspector when the test report is not for validation.
b. Preliminary. Used by the contractor to submit the report in the time period required in the specifications. A final report must follow.
c. Final. Used to indicate that the report is being submitted for acceptance.
d. Corrected. Used to indicate that there was either an error in the original test report or that the section was corrected by grinding and retested.
3. Test report laboratory numbers must be continuous and increasing numerically as each succeeding test is performed. Laboratory numbers shall have a letter added to the end of the original laboratory number for corrected reports (i.e., original report number 01-218L-05, corrected report number 01-218L-05-A). Put the Laboratory Number on the trace roll.
4. Contractor test reports shall have one of the following at the bottom of the report:
e. No Corrective Work Required.
f. Corrective Work Required.
g. Corrective Work Completed.
5. The corrected test report shall include all the information and data from the original test report and also show the retested profile index for each corrected segment. Identified bumps and dips shall be noted as corrected.
6. Rounding for reporting shall be as follows:
Length to 3 decimal places, miles
Roughness to 2 decimal places, inches (0.01 for computers, 0.05 for manual)
Profile index to 2 decimal places, Inches/mile
The method for rounding for reporting and determination of specification compliance shall be according to the “Rounding Method” in IM 202.
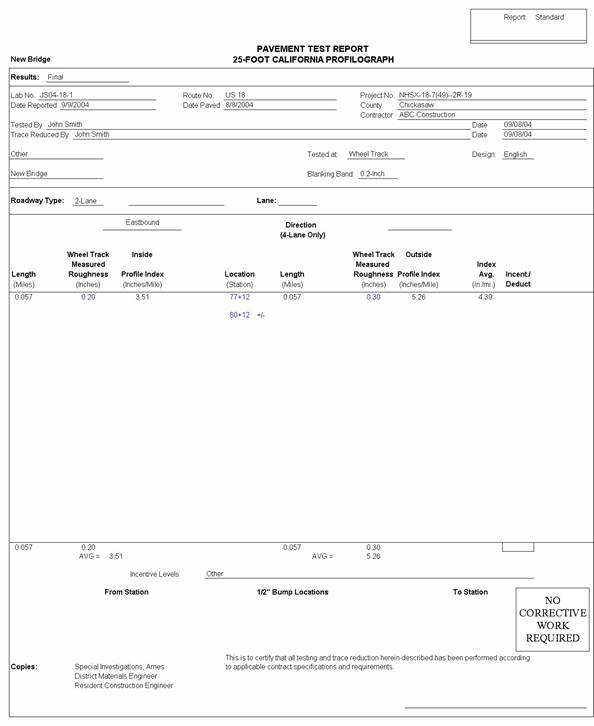
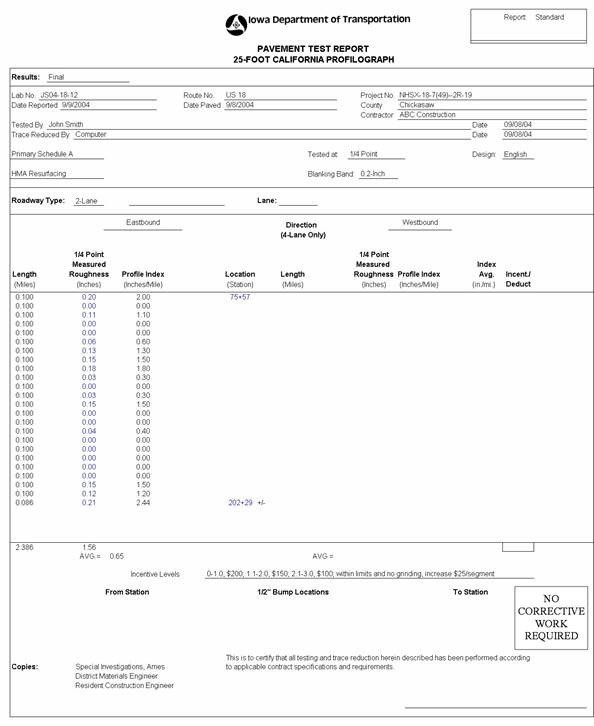
7. An example of a completed report form is shown in Figure 15. Always start with a full 0.10-mile segment and align both directions or lanes on the form.
8. The reverse side of Form #821301 is for bridge decks. An example of a completed bridge deck monitor report is shown in Figure 16.
9. The certified profilograph test report shall have the name and certification number of the person doing the testing, the person performing the analysis, and the person completing the test report.
Each certified profilograph test report must also include the following certification statement:
“This is to certify that all testing and trace reduction herein described has been performed according to applicable contract specifications and requirements.”
10. Certified profilograph reports shall have the following distribution:
RCE, County or City Engineer
District Materials Engineer
Special Investigations Engineer (will make Ames distribution)
Contractor (For Iowa DOT Personnel)
Subcontractor (For Iowa DOT Personnel)
11. The report and profilogram submittal may be in an electronic form compatible with the Agency’s computer system (Adobe Acrobat PDF format for the profilogram). The Engineer may require a paper submittal of reports and profilograms if there are errors in the reports or validation is not achieved.
J. Certification
1. A trained, certified person shall do the testing, evaluation, and complete the test report.
2. Basis of certification is in Materials IM 213. Applications should be sent to the Technical Training & Certification Program Coordinator.
VALIDATION OF CONTRACTOR TEST RESULTS
In order to use the Contractor test results in the acceptance decision, the results must be validated.
Normally the District Materials Office will perform verification testing within 1 month from receiving finals test reports and notification from the Contractor that the bridge or pavement is available for testing. The validation tolerances are in IM 216. When wheel path testing is specified, both wheel paths will be averaged for validation comparison (unless safety concerns or other conditions don’t permit).
When the Contractor test results cannot be validated, the District Materials Office will promptly notify the Contractor and begin the dispute resolution process. Testing disputes arising between the Contracting Agency and the Contractor shall be resolved in a reliable, unbiased manner or an evaluation performed by the Iowa DOT Central Materials Laboratory. Resolution decisions by the Iowa DOT Central Materials Laboratory will be final.
The District Materials Engineer will select some or all of the following steps for the dispute resolution:
1. Check all numbers and calculations.
2. Review testing procedures.
3. Compare profilograms and dates of testing.
4. Check equipment operation, calibrations and tolerances.
5. Perform side-by side tests.
6. Involve the Central Materials Laboratory.
If the discrepancy cannot be resolved using the steps listed above, or if it is determined that the Contractor’s testing is in error, then the Agency test results will be used for the acceptance decision for the project.
|
Figure 1. 25-Foot California Type Profilograph |
|
|
|
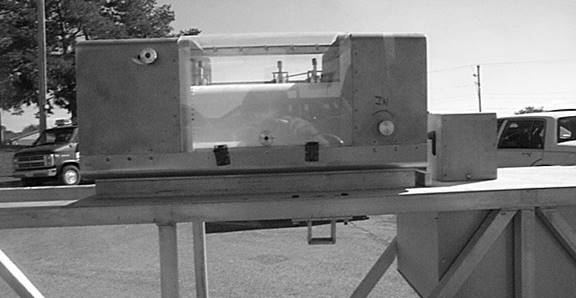
Figure 2. Manual Profilograph Recording Unit |
|
|
|
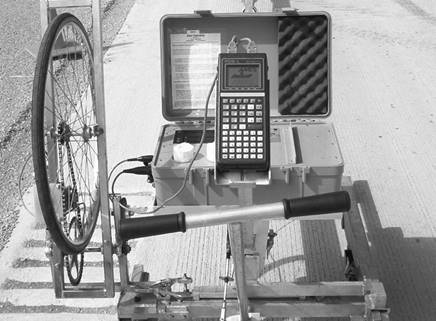
Figure 3. Computerized Profilograph |
|
|
|
Figure 4. Light Weight Inertial Profiler |
|
|
|
Figure 5. Blanking Band and Bump Template |
|
|
|
Figure 6. Location for Testing Bridge Decks |
|
|

|
Figure 7. Testing at Headers |
|
|

|
Figure 8. Excluded Area from Profile Index for Side Roads over 600 Feet |
|
|
|
|
|
Figure 9. Starting and Stopping Location for Tapers |
|
|
|
Figure 10. Testing of Bridge Approach Sections |
|
|
|
Figure 11. Manual Trace Reduction Conditions |
|
|

|
Figure 12. Examples Using the Bump Template |
|
|
|
Figure 13. Example of Blanking Band Placement |
|
|
|
Figure 14. Area to be Tested for Pavement Patches |
|
|
|
Patch Testing Procedure Specification 2529.03, H
Run the profilograph from “A” to “F” Analyze for P.I. from “A” to “F” Analyze for P.I. from “A” to “B” Analyze for P.I. from “E” to “F”
Compare the profile index of Line AF to the index of the ABI
ABI = AB + EF 2
|
|
Figure 15. Sample Pavement Test Report |
|
|
|
Figure 16. Sample Bridge Test Report |
|
|